Solutions AP Assure AP Accurate AP Automate AP Assist AP Analyze Pricing Integrations About Us Resources Blog Videos Request a Demo
AP Analyze

One dashboard for your entire AP operation

AP Analyze pulls data from every module and directly from your ERP into customizable BI dashboards. Track KPIs, spot trends, and drill down to individual transactions.

See it with your own data. Free proof of concept included.

AP Analyze BI dashboard showing gauge charts, bar charts, and reconciliation data by supplier

Your AP data is scattered across too many places to be useful

Reporting means exporting and stitching

Your reconciliation data lives in one tool. Duplicate detection results in another. Invoice processing metrics in a third. When leadership asks for a report, someone exports data from each system, drops it into a spreadsheet, and spends hours aligning formats and filling gaps. The result is a snapshot that is already out of date by the time anyone reads it.

Siloed data hides patterns

The deeper issue is that siloed data hides patterns. A supplier that triggers frequent duplicate flags might also generate high query volumes and slow reconciliation. You would only see that connection if all the data lived in the same place. Right now, it doesn't.

Cross-module analytics that show you what siloed tools can't

Real-time BI dashboards

Pre-built dashboards cover reconciliation performance, duplicate risk, invoice processing rates, supplier query volumes, and more. Gauge charts, bar charts, trend lines, and supplier breakdowns update in real time as data flows through the platform. No refresh button. No nightly sync.

Customizable KPIs and reports

Track what matters to your team. DPO, processing cost per invoice, early payment discounts captured, exception rates, and any other metric you need. Build custom dashboards from scratch or modify the pre-built ones. AP Analyze adapts to how your team measures performance, not the other way around.

Cross-module intelligence

Because it draws from AP Assured, AP Accurate, AP Automate, and AP Assist simultaneously, it can surface patterns that no single-purpose tool can see. Duplicate trends correlated with specific suppliers. Reconciliation discrepancies linked to invoice processing exceptions. Query volumes mapped against payment timelines. The full picture, not fragments.

Automated alerts and scheduled reports

Set thresholds and let the platform notify you when something needs attention. A spike in duplicate flags for a specific vendor. Reconciliation completion rates dropping below target. Alerts land in your inbox or dashboard. Scheduled reports go out to stakeholders on whatever cadence you choose.

Real-time
Dashboards update as data flows through the platform, no batch processing
Cross-module
Analytics spanning reconciliation, duplicates, invoices, queries, and more
Drill to detail
From high-level KPI to individual transaction in clicks
Export-ready
PDF, Excel, CSV reporting for leadership and audit

The module that makes every other module more visible

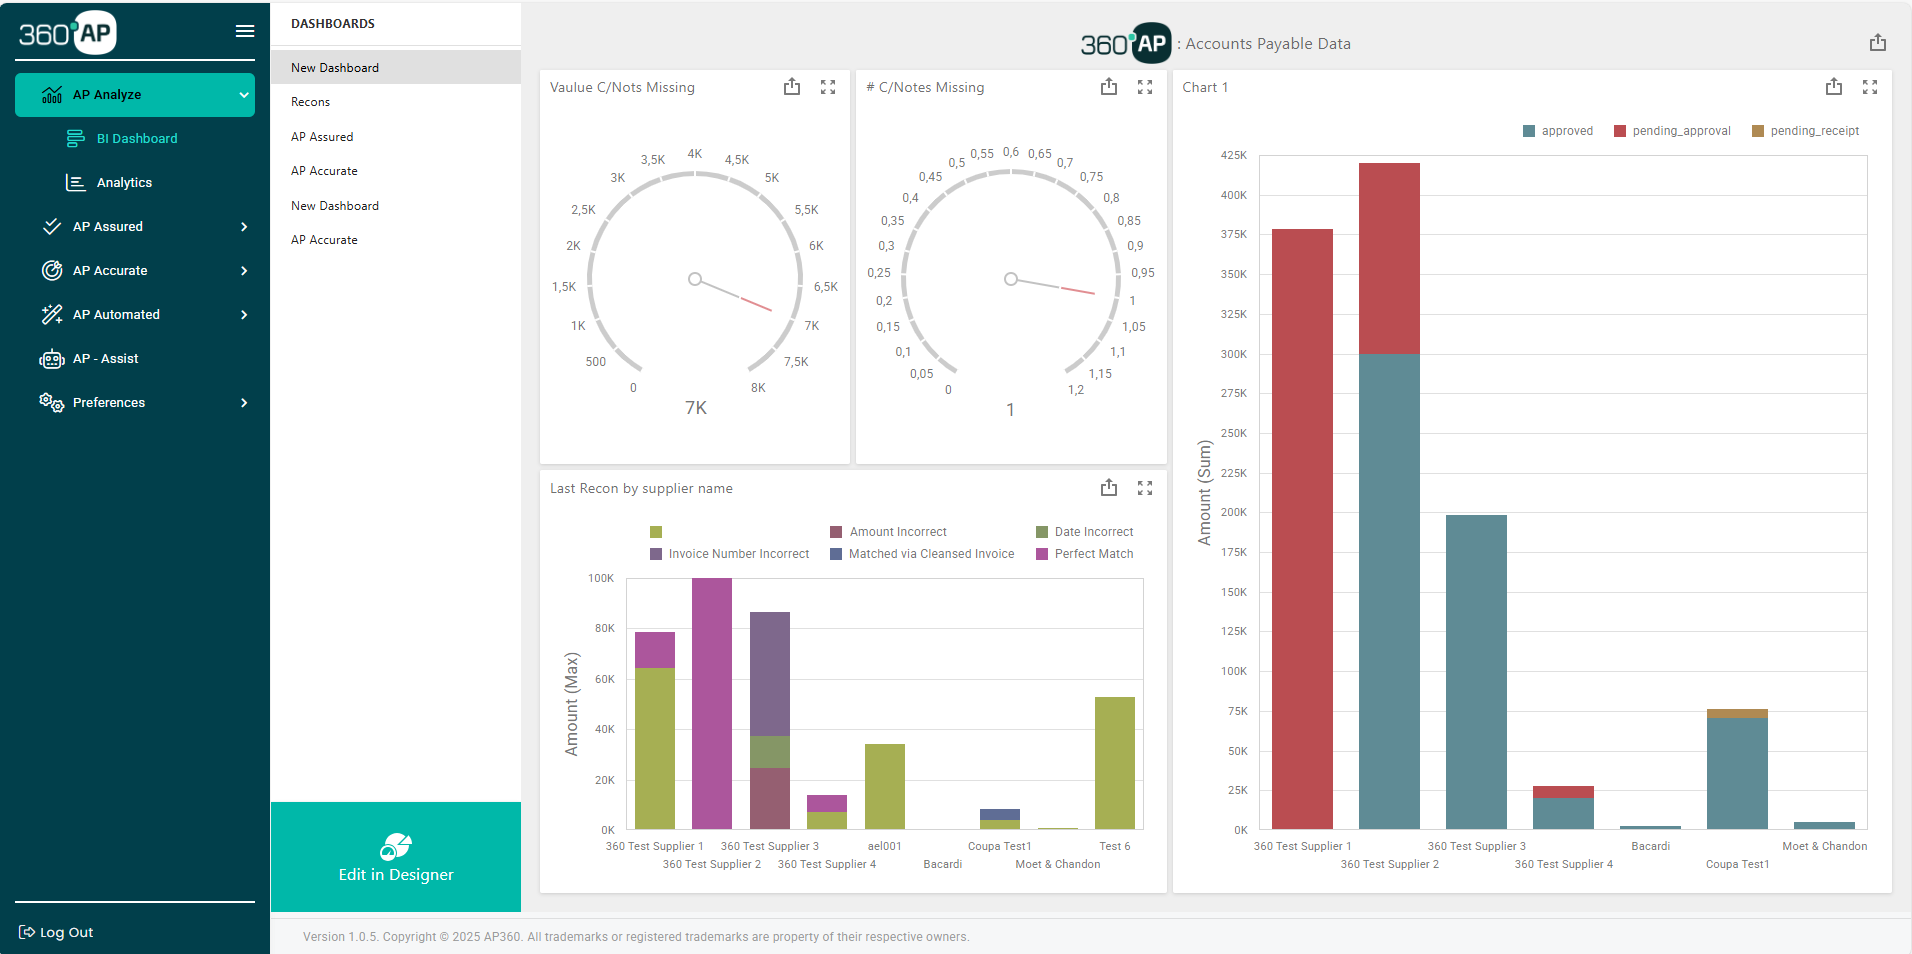
AP Analyze is the reporting layer for the entire 360° AP platform. When AP Assured catches a duplicate, AP Analyze tracks whether it is an isolated event or part of a trend. When AP Accurate completes a reconciliation, AP Analyze logs the turnaround time and accuracy rate. When AP Automate processes an invoice batch, AP Analyze captures throughput and exception rates. When AP Assist resolves a supplier query, AP Analyze records the resolution time and whether it was autonomous or escalated.

Every action taken in every module feeds into one set of dashboards. That is what makes the analytics complete.

See your AP metrics in AP Analyze

Connect your ERP data and see what your AP operation looks like in one dashboard. Reconciliation performance, duplicate exposure, processing rates, and query volumes. All in one view. Free proof of concept. No commitment.